SVM in R
What is SVM
In machine learning, classification is a major type of problems. Many methods have been developed to classify data points into different categories, such as logistic regression. However, logistic regression only performs well for log linear datasets. Many datasets are high dimensional and nonlinear. In this case, Support Vector Machine (SVM) can help.
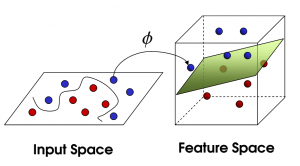
SVM tries to separate data using hyperplane. That is to say, datsets that is not linearly separable may be separable in high-dimensional space. SVM identifies the hyperpalne that separates the dataset in the high-dimensional space1.

Therefore, it is able to classify nonlinear problems. It generalizes a simple classifier named maximal margin classifier. For a nonlinear feature space, SVM creates nonlinear decision boundary to separate the nonlinear datasets, with the help of kernel.
What is kernel
Kernel is a mathematical transformation for SVM to classify nonlinear datasets. Formally, it is a function to quantifies the similarity of two observations2. Essentially, kernel is a mapping between classification problem and a metric space. Metric space is mathematical object related to the notion of “distance”, such as Euclidean distance.
Kernel is the key to tranform input space to high-dimensional feature space. More technical details can be found in Bishop’s machine learning book3.
Here, I won’t go into technical details. Just remember, kernels are carefully designed mathematical tools to help you classify nonlinear data.
This blog explains kernel trick very nicely.
Quick SVM in R
At first, I assume you have reasonable working knowledge with R. Many R packages support SVM. One of the most famous is e1071. So the first step is to load e1071 and the dataset.
require(e1071)
require(dplyr)
Assume we have a training dataset name data1, which contains many rows and several columns (let’s assume these columns named y, x1, x2, etc. where y is a factor variable for classification; you can try some real datasets such as the famous iris dataset). Assume the test dataset name data2. We can build a SVM model as following,
# convert label from `bool` to `int`
data1 <- data1 %>% mutate(y = y*1)
data2 <- data2 %>% mutate(y = y*1)

svm.model <- svm(y ~ .,
                 data=data1,
                 method="C-classification",
                 kernel="radial") # use RBF as kernel function
summary(svm.model)

pred.train <- predict(svm.model, data1) # in-sample test
mean(pred.train==data1$y) # classification rate
Tune SVM parameters
Of course, the SVM model may perform poorly. We can tune the model parameters to improve (1) the performance of the model; (2) the speed of convergence. SVM model can be tuned as following,
tune_out <- tune.svm(y~.,
                     data=data1,
                     gamma=10^(-3:3),
                     cost=c(0.01,0.1,1,10,100,1000) ) # e1071 tune functions have internal iteration limits, in this case, it is better to use another package

compareTable <- table (data1$y, predict(svm.model))  # tabulate
mean(data1$y != predict(svm.model)) # misclassification rate
Conclusion
SVM is a powerful algorithm to classify both linear and nonlinear high-dimensional data. Its implementation in R is simple. This guide gives basic explanation about SVM in R.
-
Support Vector Machines explained well. http://bytesizebio.net/2014/02/05/support-vector-machines-explained-well/ ↩
-
James, G., Witten, D., Hastie, T., & Tibshirani, R. (2013). An introduction to statistical learning-with applications in R. In G. Casella, S. Fienberg, & I. Olkin (Eds.), Springer Texts in Statistics (1 ed., pp. XIV, 426): Springer-Verlag New York. ↩
-
Bishop, C. (2006). Pattern Recognition and Machine Learning. Springer. Stat Sci. ↩
-
A gentle introduction to support vector machines using R. Eight to Late. https://eight2late.wordpress.com/2017/02/07/a-gentle-introduction-to-support-vector-machines-using-r/ ↩
-
支持向量机SVM在R中的实现. https://blog.csdn.net/nieson2012/article/details/51354284 ↩